4 Figure3
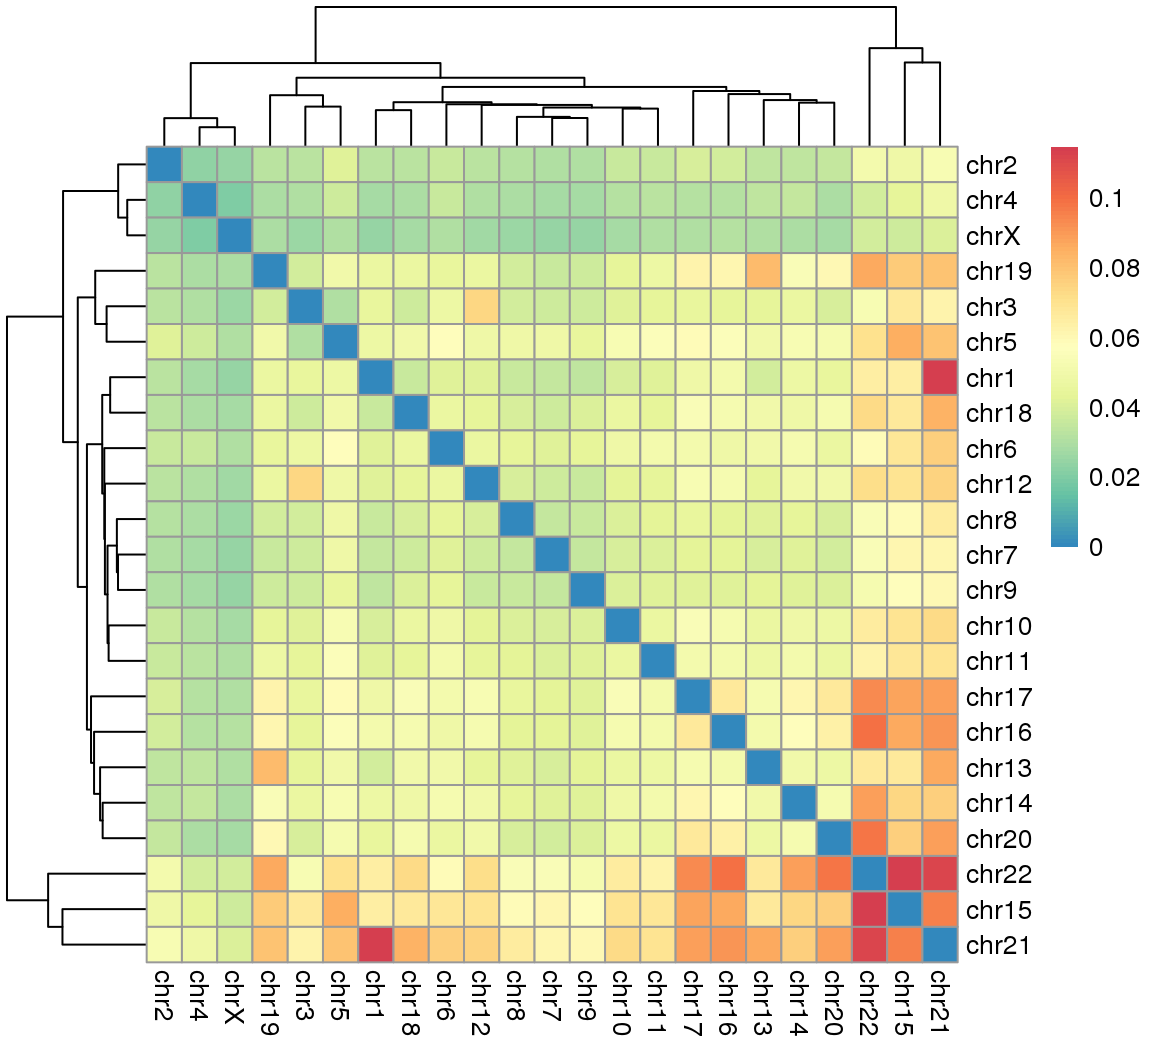
4.1 Fig.3a
df = read.csv('data/3A.csv',header = T,row.names = 1)
head(df[1:3,1:3])
## chr1 chr2 chr3
## chr1 0.00000000 0.03254124 0.04552237
## chr2 0.03254124 0.00000000 0.03214177
## chr3 0.04552237 0.03214177 0.00000000library(RColorBrewer)
suppressMessages(library(pheatmap))
pheatmap(df,
color = rev(colorRampPalette(c(brewer.pal(9,"Spectral")))(100))
)
4.2 Fig.3b
df = read.table('data/3b_data',header = T)
head(df)[1:3,1:3]
## V103 V102 V101
## 1 0 0 0
## 2 0 0 0
## 3 0 0 0df = as.matrix(df)
suppressMessages(library(matlab))
suppressMessages(library(fields))
library(RColorBrewer)
col.ls <- colorRampPalette(c('red','white'))(4000)
col.ls <- rev(col.ls)
image.plot(x = 1:nrow(df), y = 1:ncol(df), z = df, xlab = "", ylab = "", col = col.ls, cex = 1, axes=F,legend.cex = 0)
box()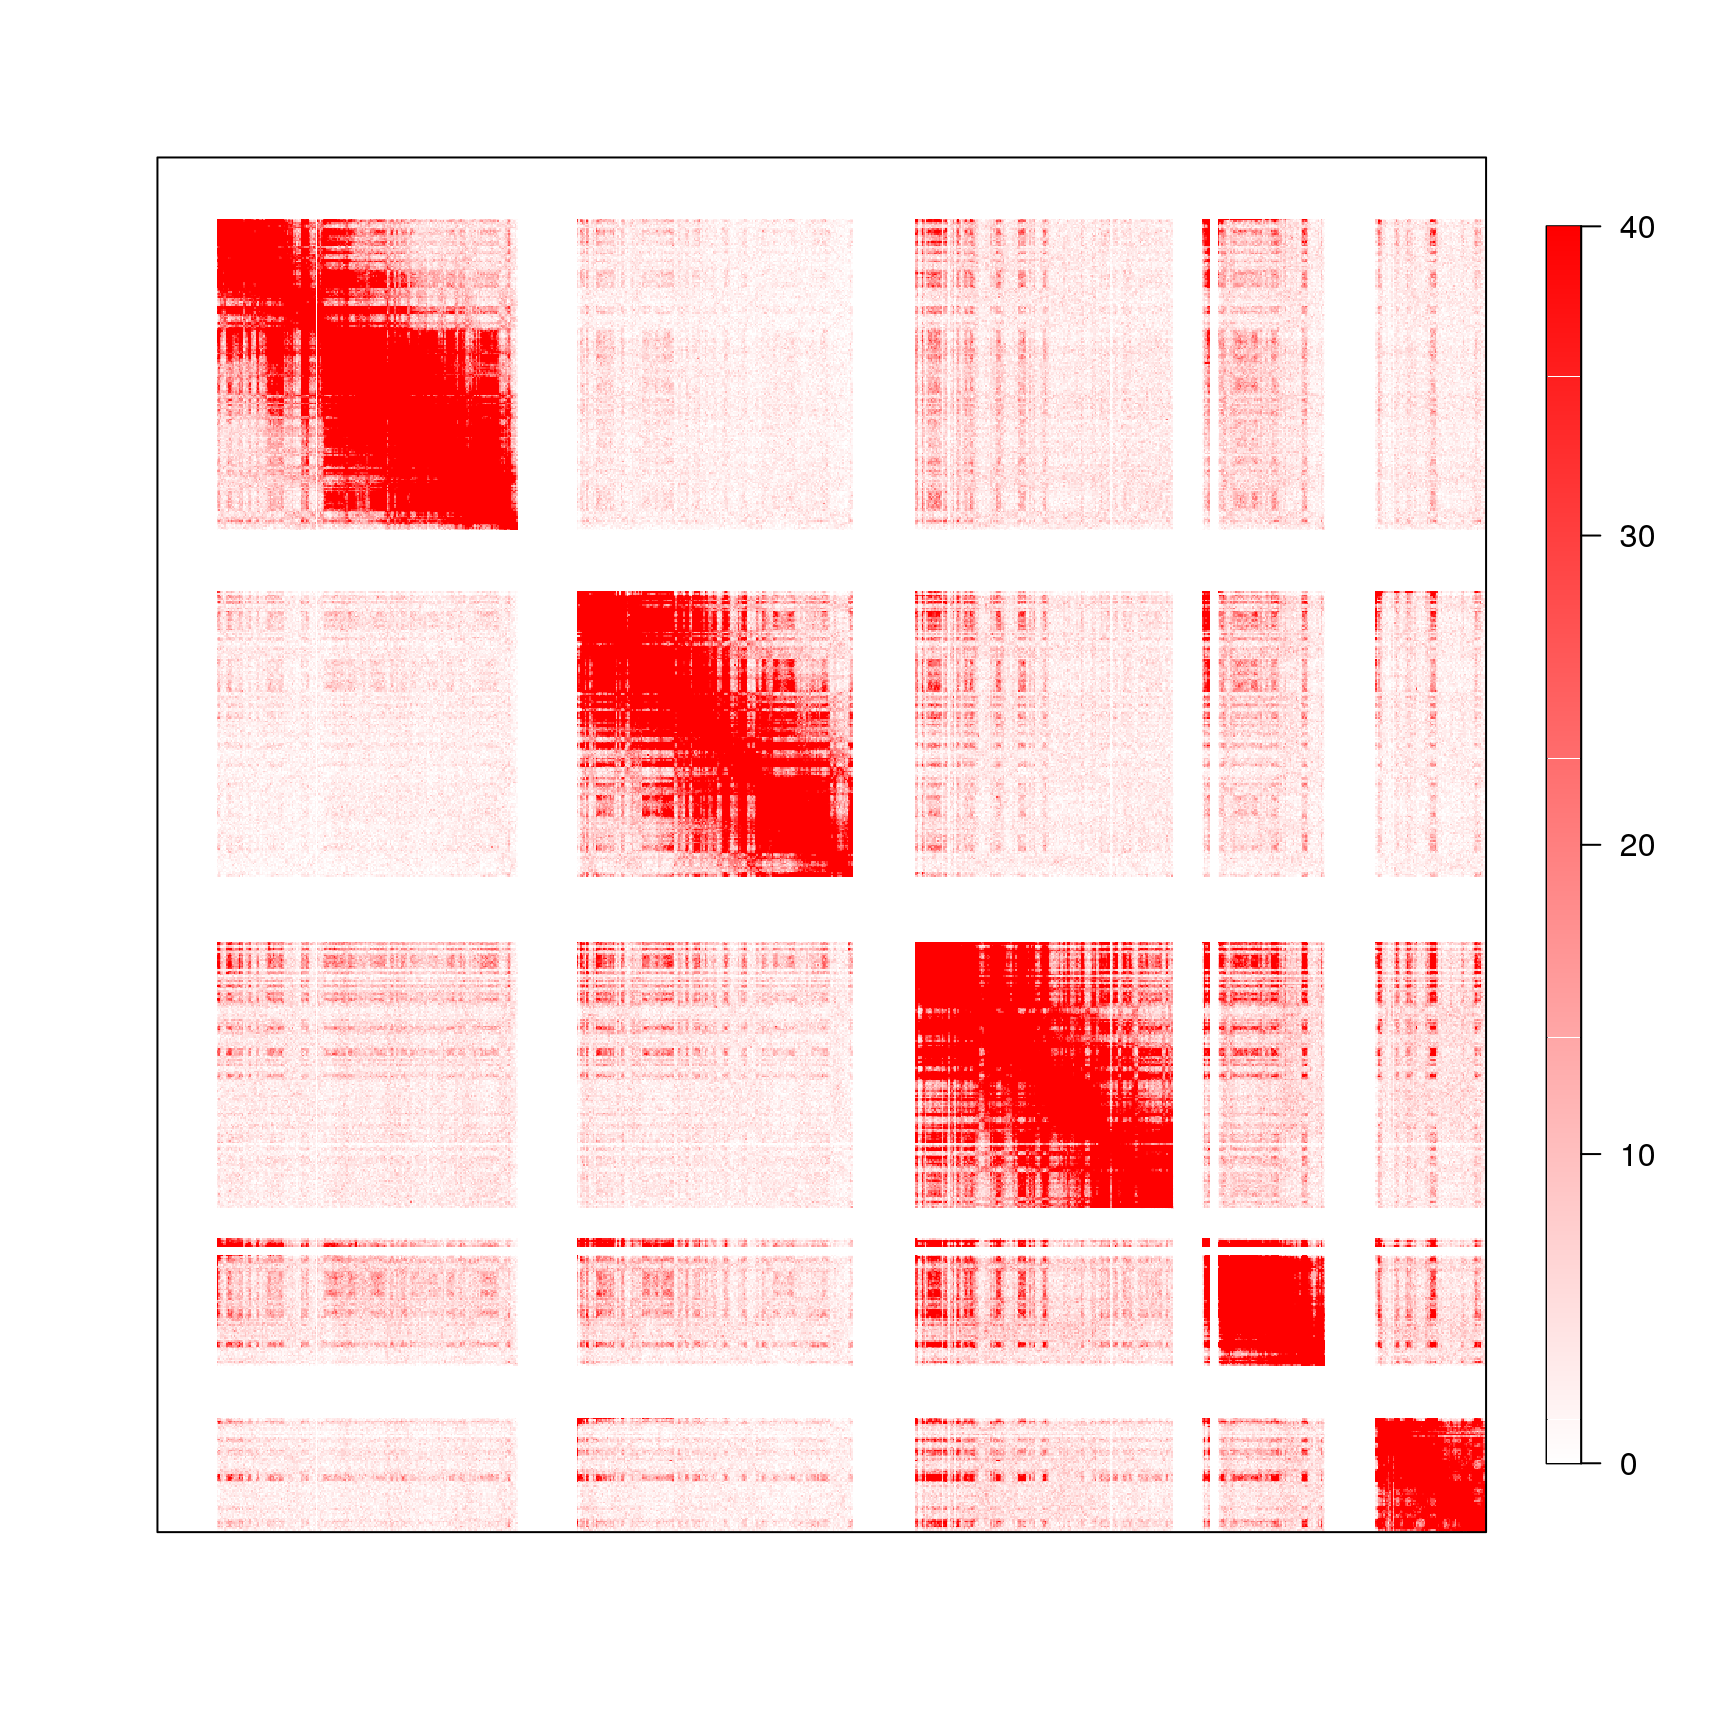
4.3 Fig.3c
df = read.table('data/3c_data',header = T)
head(df)
## Group value
## 1 chr13 0.03869764
## 2 chr13 0.03388018
## 3 chr13 0.04395268
## 4 chr13 0.03348364
## 5 chr13 0.05039276
## 6 chr13 0.05006650df$Group = factor(df$Group,levels = c('chr13','14','15','21','22'))
boxplot(df$value ~ df$Group ,
col = c(rep('skyblue',2),rep('orange',3)),
ylab = 'Normalized contacts',
las = 1,xlab = '',outline=F,ylim = c(0,0.12))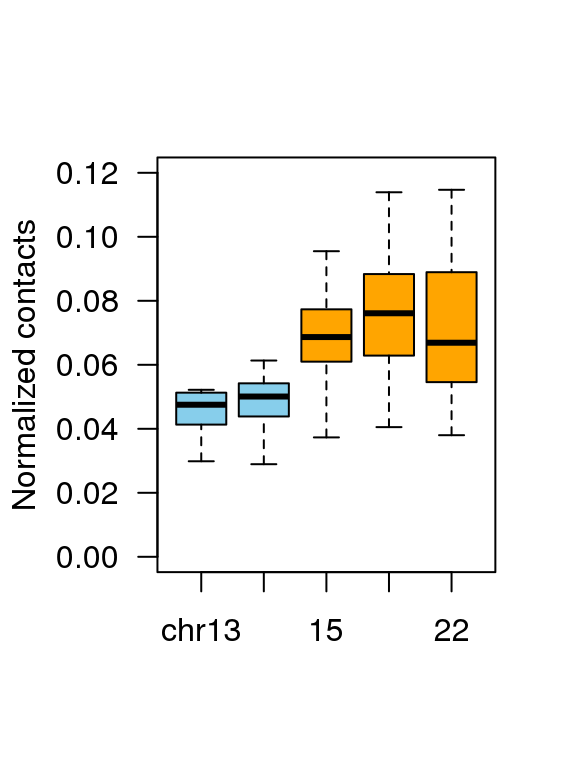
4.4 Fig.3d
df = read.table('data/3d_data',header = T)
head(df)
## Group value
## 1 chr13 0.04986233
## 2 chr13 0.06765239
## 3 chr13 0.08644709
## 4 chr13 0.06756526
## 5 14 0.04986233
## 6 14 0.07438547df$Group = factor(df$Group,levels = c('chr13','14','15','21','22'))
boxplot(df$value ~ df$Group ,
col = c(rep('skyblue',2),rep('orange',3)),
ylab = 'Normalized contacts',
las = 1,xlab = '',outline=F,ylim = c(0,0.15))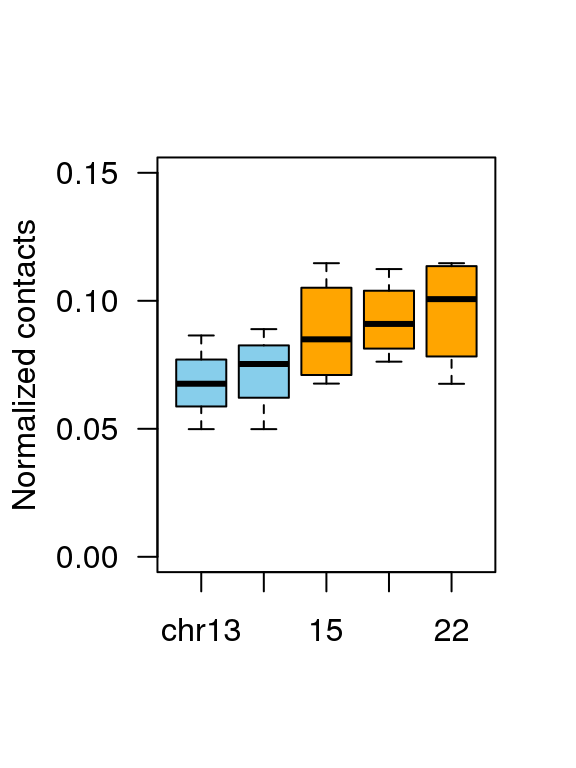
4.5 Fig.3f
data <- data.frame(
  group=c('rDNA-rDNA','rDNA-Other'),
  value=c(76,24)
)
suppressMessages(library(ggplot2))
suppressMessages(library(dplyr))
data <- data %>%
  arrange(desc(group)) %>%
  mutate(prop = value / sum(data$value) *100) %>%
  mutate(ypos = cumsum(prop)- 0.5*prop )
ggplot(data, aes(x="", y=prop, fill=group)) +
  geom_bar(stat="identity", width=1, color="white") +
  coord_polar("y", start=0) +
  theme_void() +
  theme(legend.position="none") +
  geom_text(aes(y = ypos, label = group), color = "white", size=6) +
  scale_fill_manual(values = c('#5A94CF','#A0CC58'))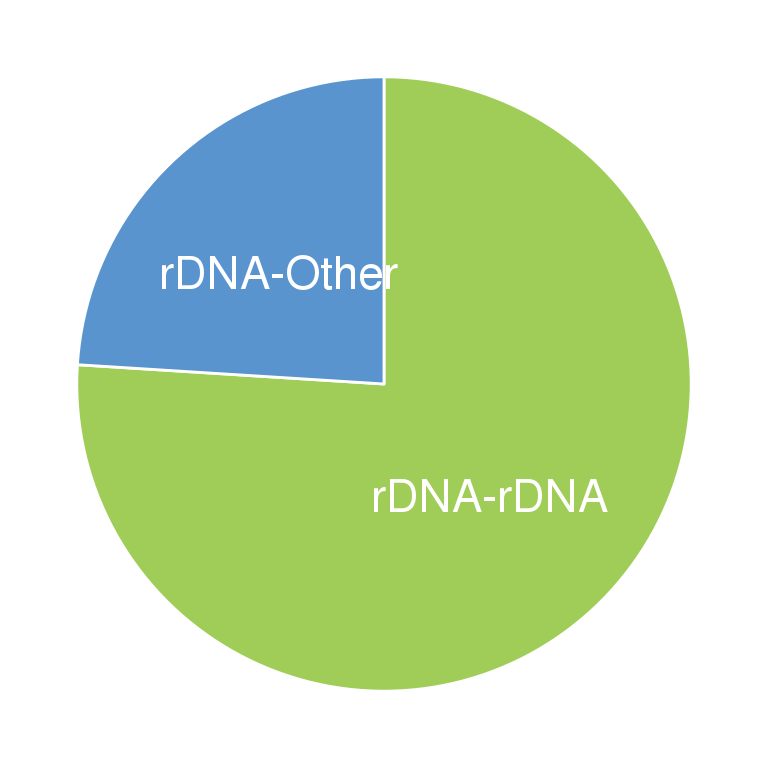
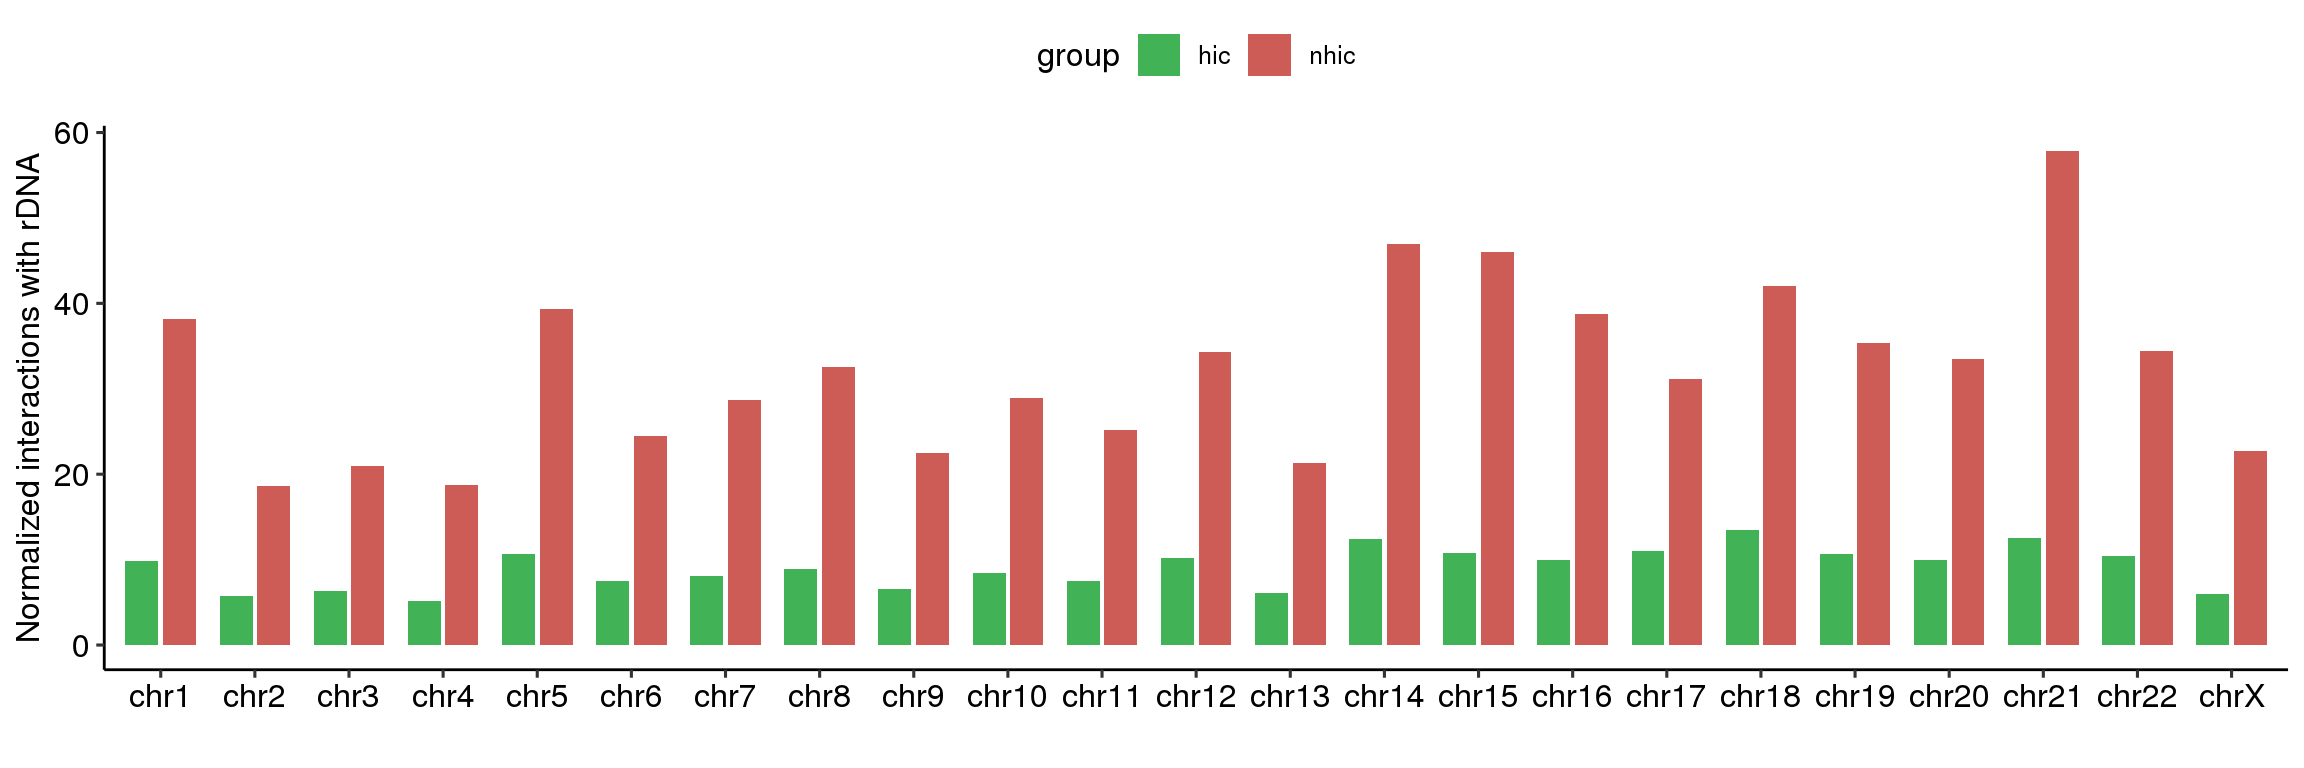
4.6 Fig.3h
df = read.table('data/3h_data',header = T)
head(df)
## chrom num group
## 1 chr1 9.780517 hic
## 2 chr10 8.399322 hic
## 3 chr11 7.512230 hic
## 4 chr12 10.223240 hic
## 5 chr13 6.110973 hic
## 6 chr14 12.422969 hicdf$chrom = factor(df$chrom,paste0('chr',c(1:22,'X')))
suppressMessages(library(ggpubr))
ggplot(df, aes(x=chrom, y=num, fill=group)) +
geom_bar(stat="identity", width=0.7, position=position_dodge(width=0.8))+
theme_pubr()+scale_fill_manual(values=c("#42B256","#CC5C55"))+
ylab('Normalized interactions with rDNA')+xlab('')