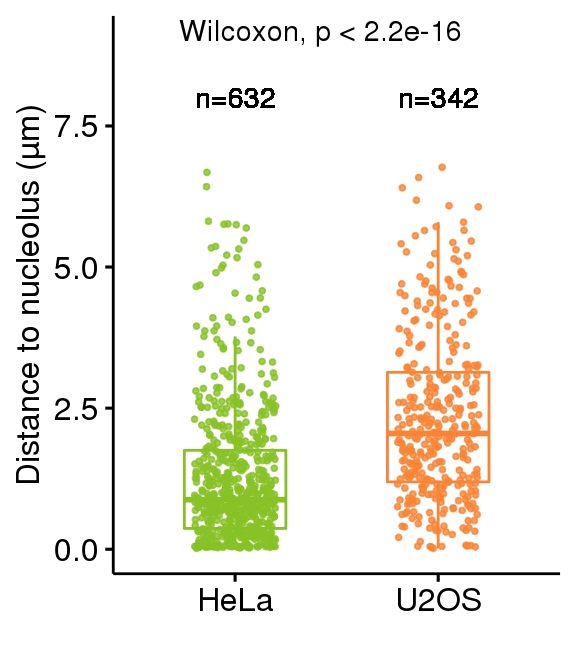
Fig.2n
df = read.csv('./data/locus5-6_meta.csv')
head(df)
##    Distance Group
## 1 0.8674372  HeLa
## 2 0.2591333  HeLa
## 3 1.4129848  HeLa
## 4 0.0830775  HeLa
## 5 1.7796608  HeLa
## 6 0.6185534  HeLa
suppressMessages(library(ggpubr))
ggboxplot(df, x = "Group", y = "Distance",
          palette =c( "#87C126","#F98435"),
          add = "jitter", width = 0.5,color = 'Group',
          add.params=list(color = "Group",size=0.7,alpha = 0.8))+
  stat_compare_means(aes(group = 'Group'),label = "p.signif")+
  stat_compare_means(label.y = 9) +
  ylab('Distance to nucleolus (μm)')+xlab('')+
  geom_text(label = paste0('n=',table(df$Group)[1]), x = 1,y = 8)+
  geom_text(label = paste0('n=',table(df$Group)[2]), x = 2,y = 8)+
  theme(legend.position='none')
## Warning: Unknown or uninitialised column: `p`.
## Warning: Computation failed in `stat_compare_means()`:
## argument "x" is missing, with no default